
By Jodie Byass
Share
In the intricate world of marketing operations, having a magnified view of your processes isn't just beneficial – it's essential. It goes beyond just managing creative projects, it's about fine-tuning the mechanisms that navigate towards successful project completions. Bearing this beacon of enhanced efficiency and clarity, we are proud to unveil the newest feature in Admation's Toolbox – Dashboard Charts.
We are excited to present the Dashboard Charts, an innovative feature meticulously crafted to refine your marketing operations. This tool serves as a powerful lens, offering a deeper understanding of your data, thereby enhancing the strategic planning and management of your marketing projects. Let's explore this feature that promises to be a catalyst in optimising your marketing workflows:
Embark on a journey with Admation's Dashboard Charts, your new hub for critical insights that fuel efficient and streamlined marketing operations. As you delve into the charts and data Admation provides, you'll discover avenues to identify bottlenecks and refine processes seamlessly. Here, we provide a glimpse of the wealth of insights that await you.
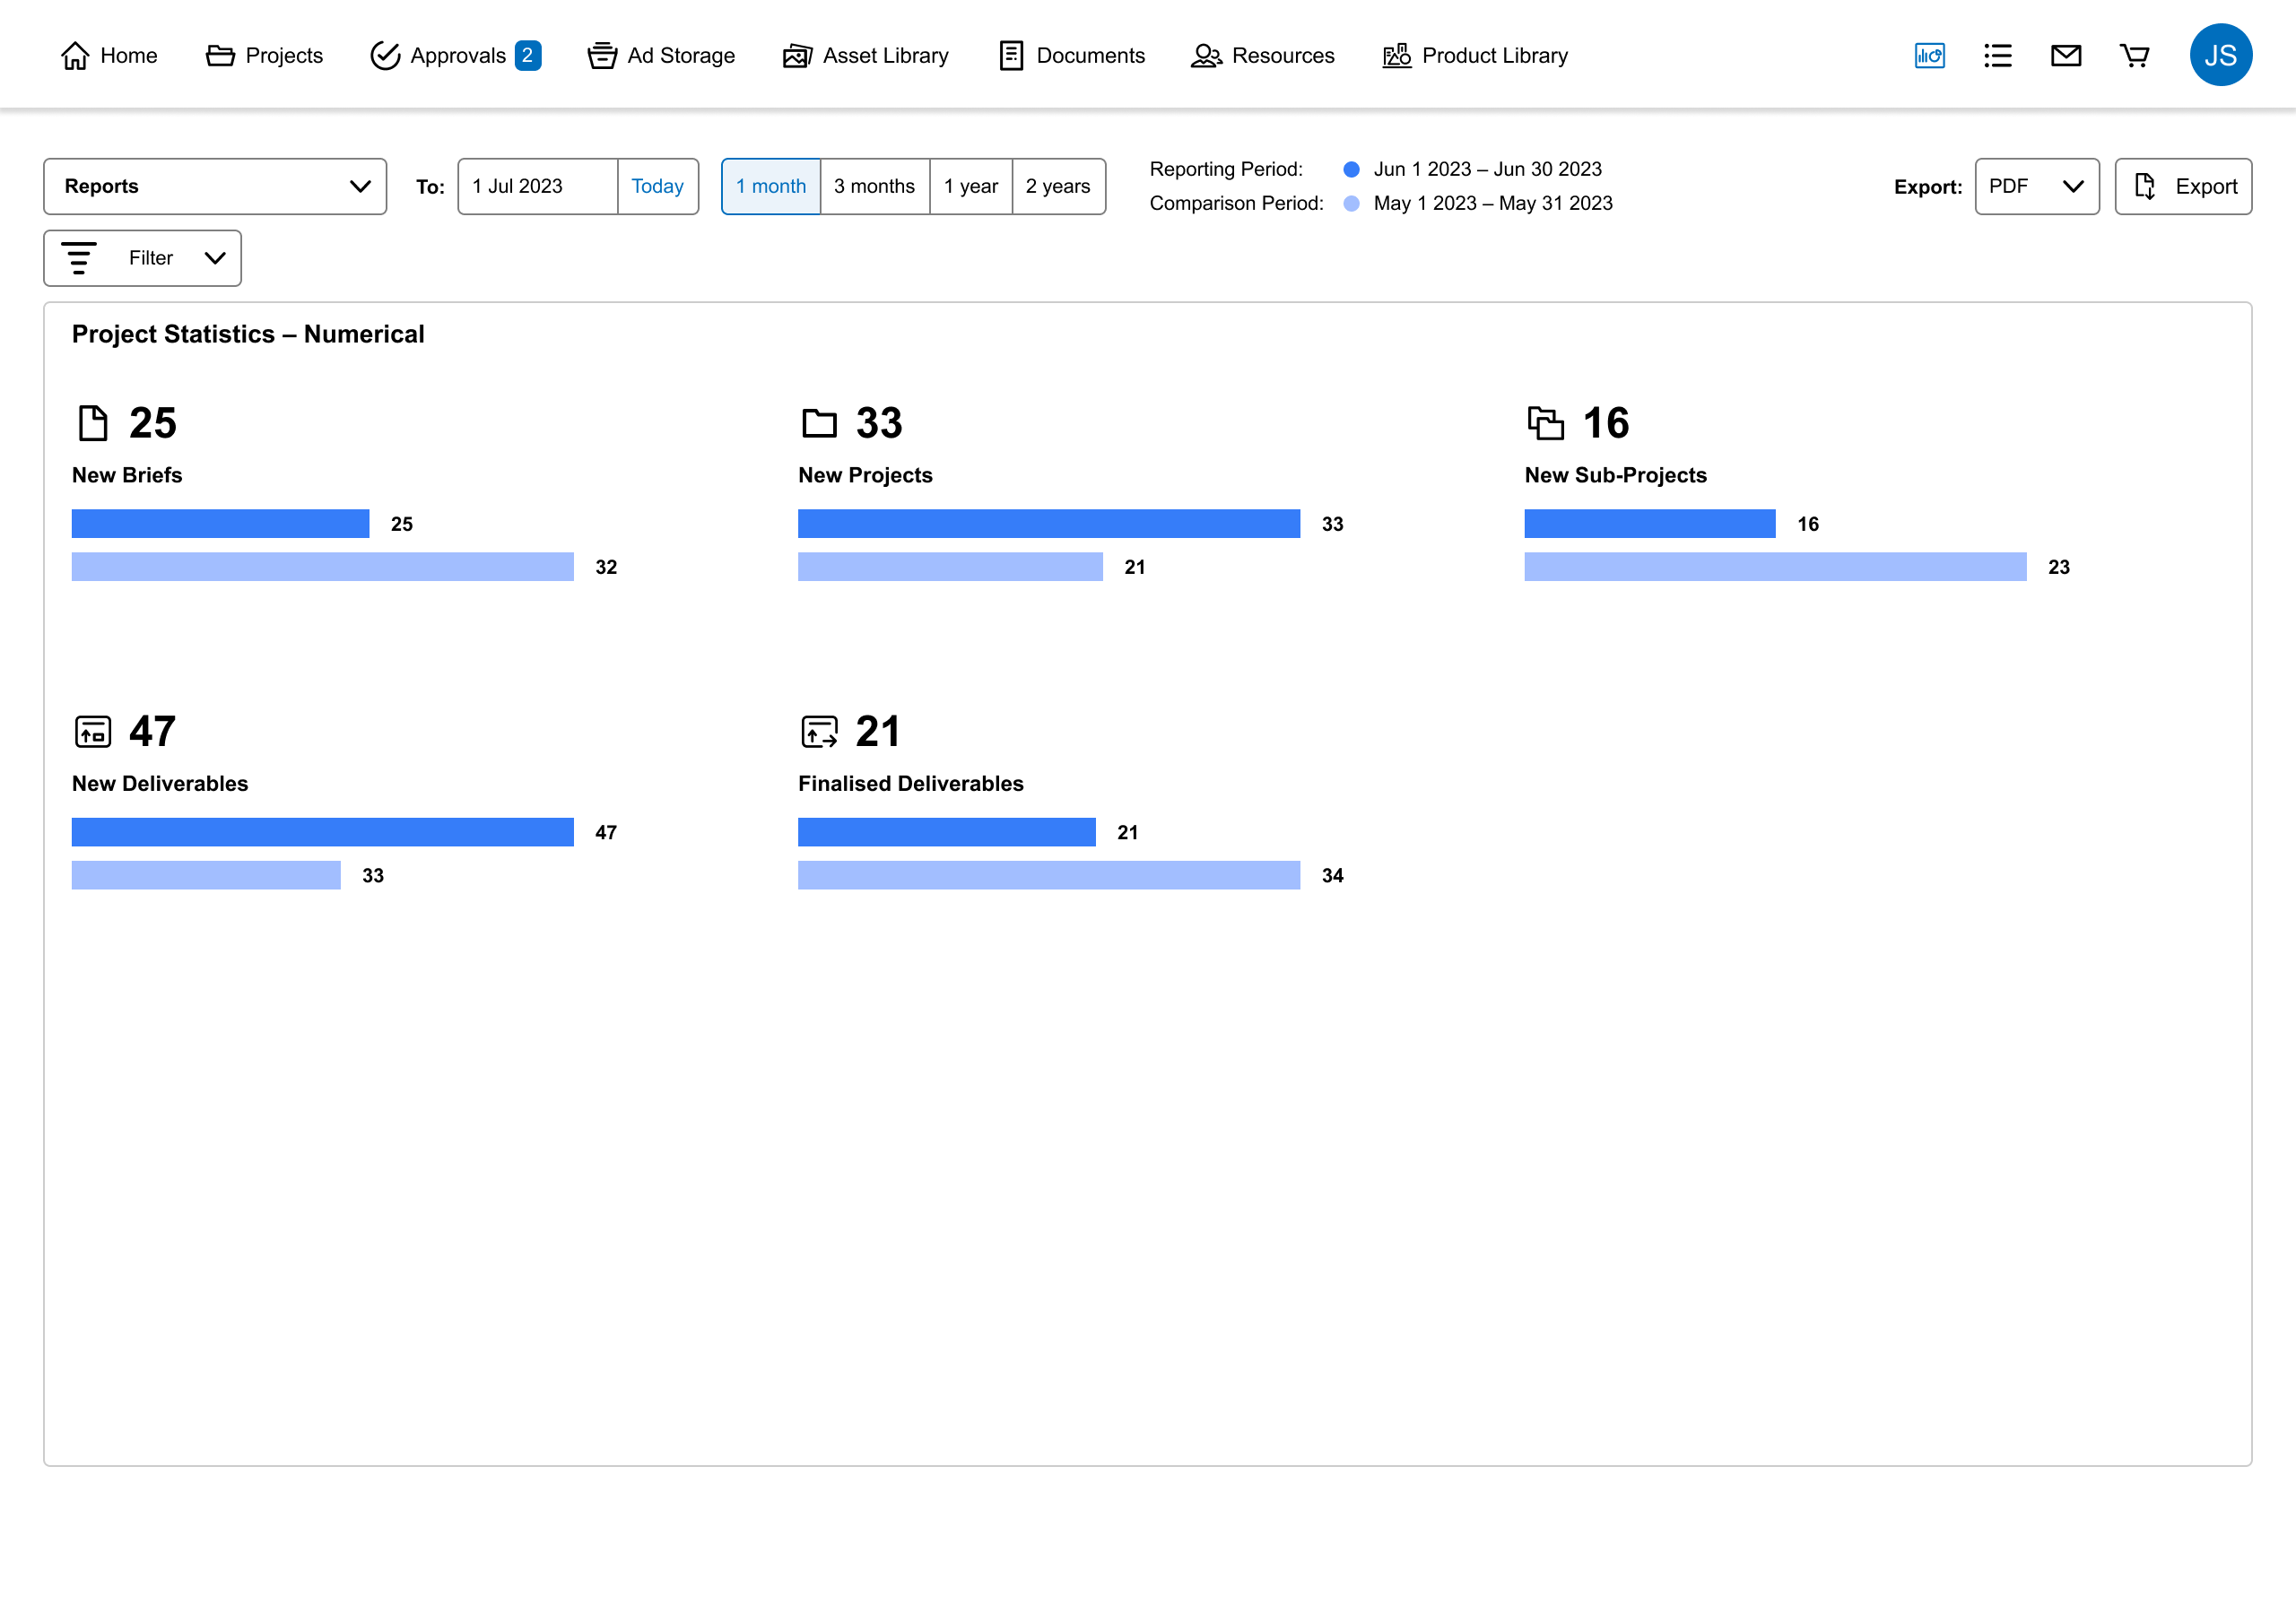
The new Dashboard Charts track the number of new projects, briefs, and finalised deliverables within specific periods. This invaluable data source enables you to monitor your team's output closely, helping to pinpoint areas for increased efficiency and ensuring that projects move forward at an optimal pace. It's an essential tool in mastering the art of marketing project management, providing a clear view of your team's progression and project delivery over time.
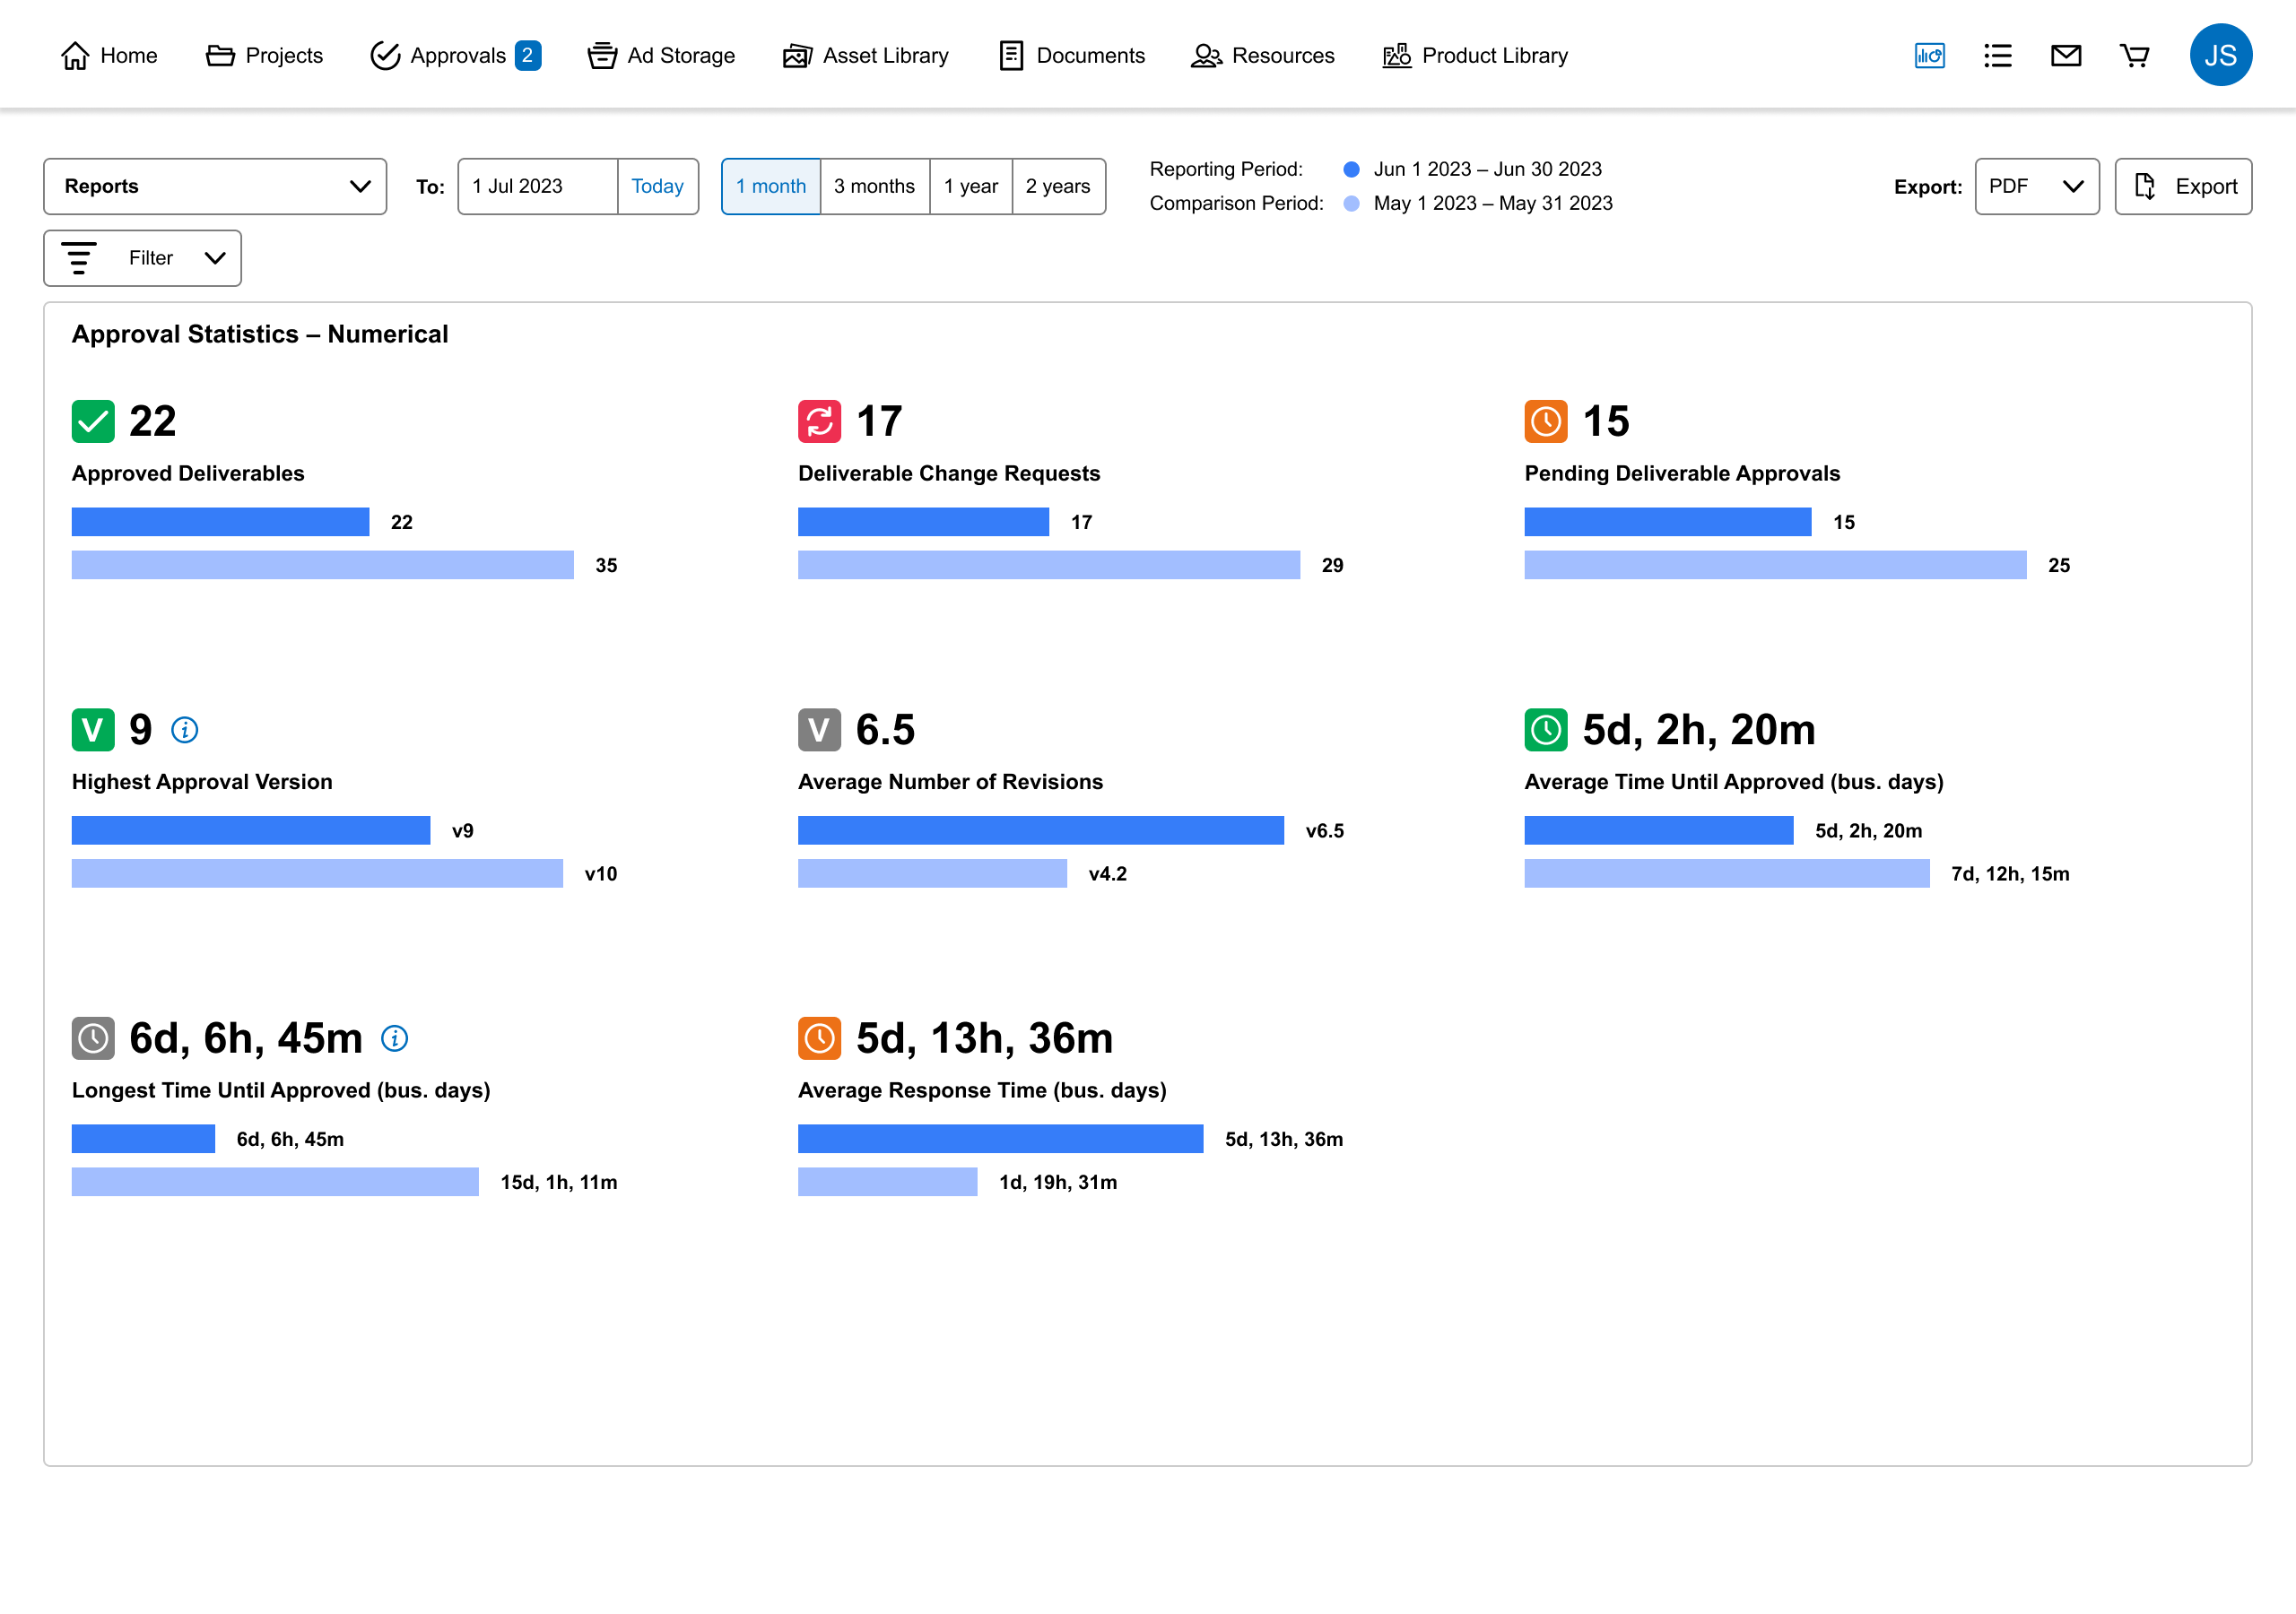
Navigating the approvals process is now easier with Admation's Dashboard Charts. Gain real-time insights into your workflow by tracking the number of pending and approved deliverables, coupled with detailed statistics on revisions and change requests over set periods. This tool not only aids in managing the present approvals in progress but also foresees potential delays, allowing you to adjust accordingly. By offering a clear view of your ongoing processes, it serves as a vital resource in optimizing your marketing approval software experience, facilitating smoother and more efficient project progression.
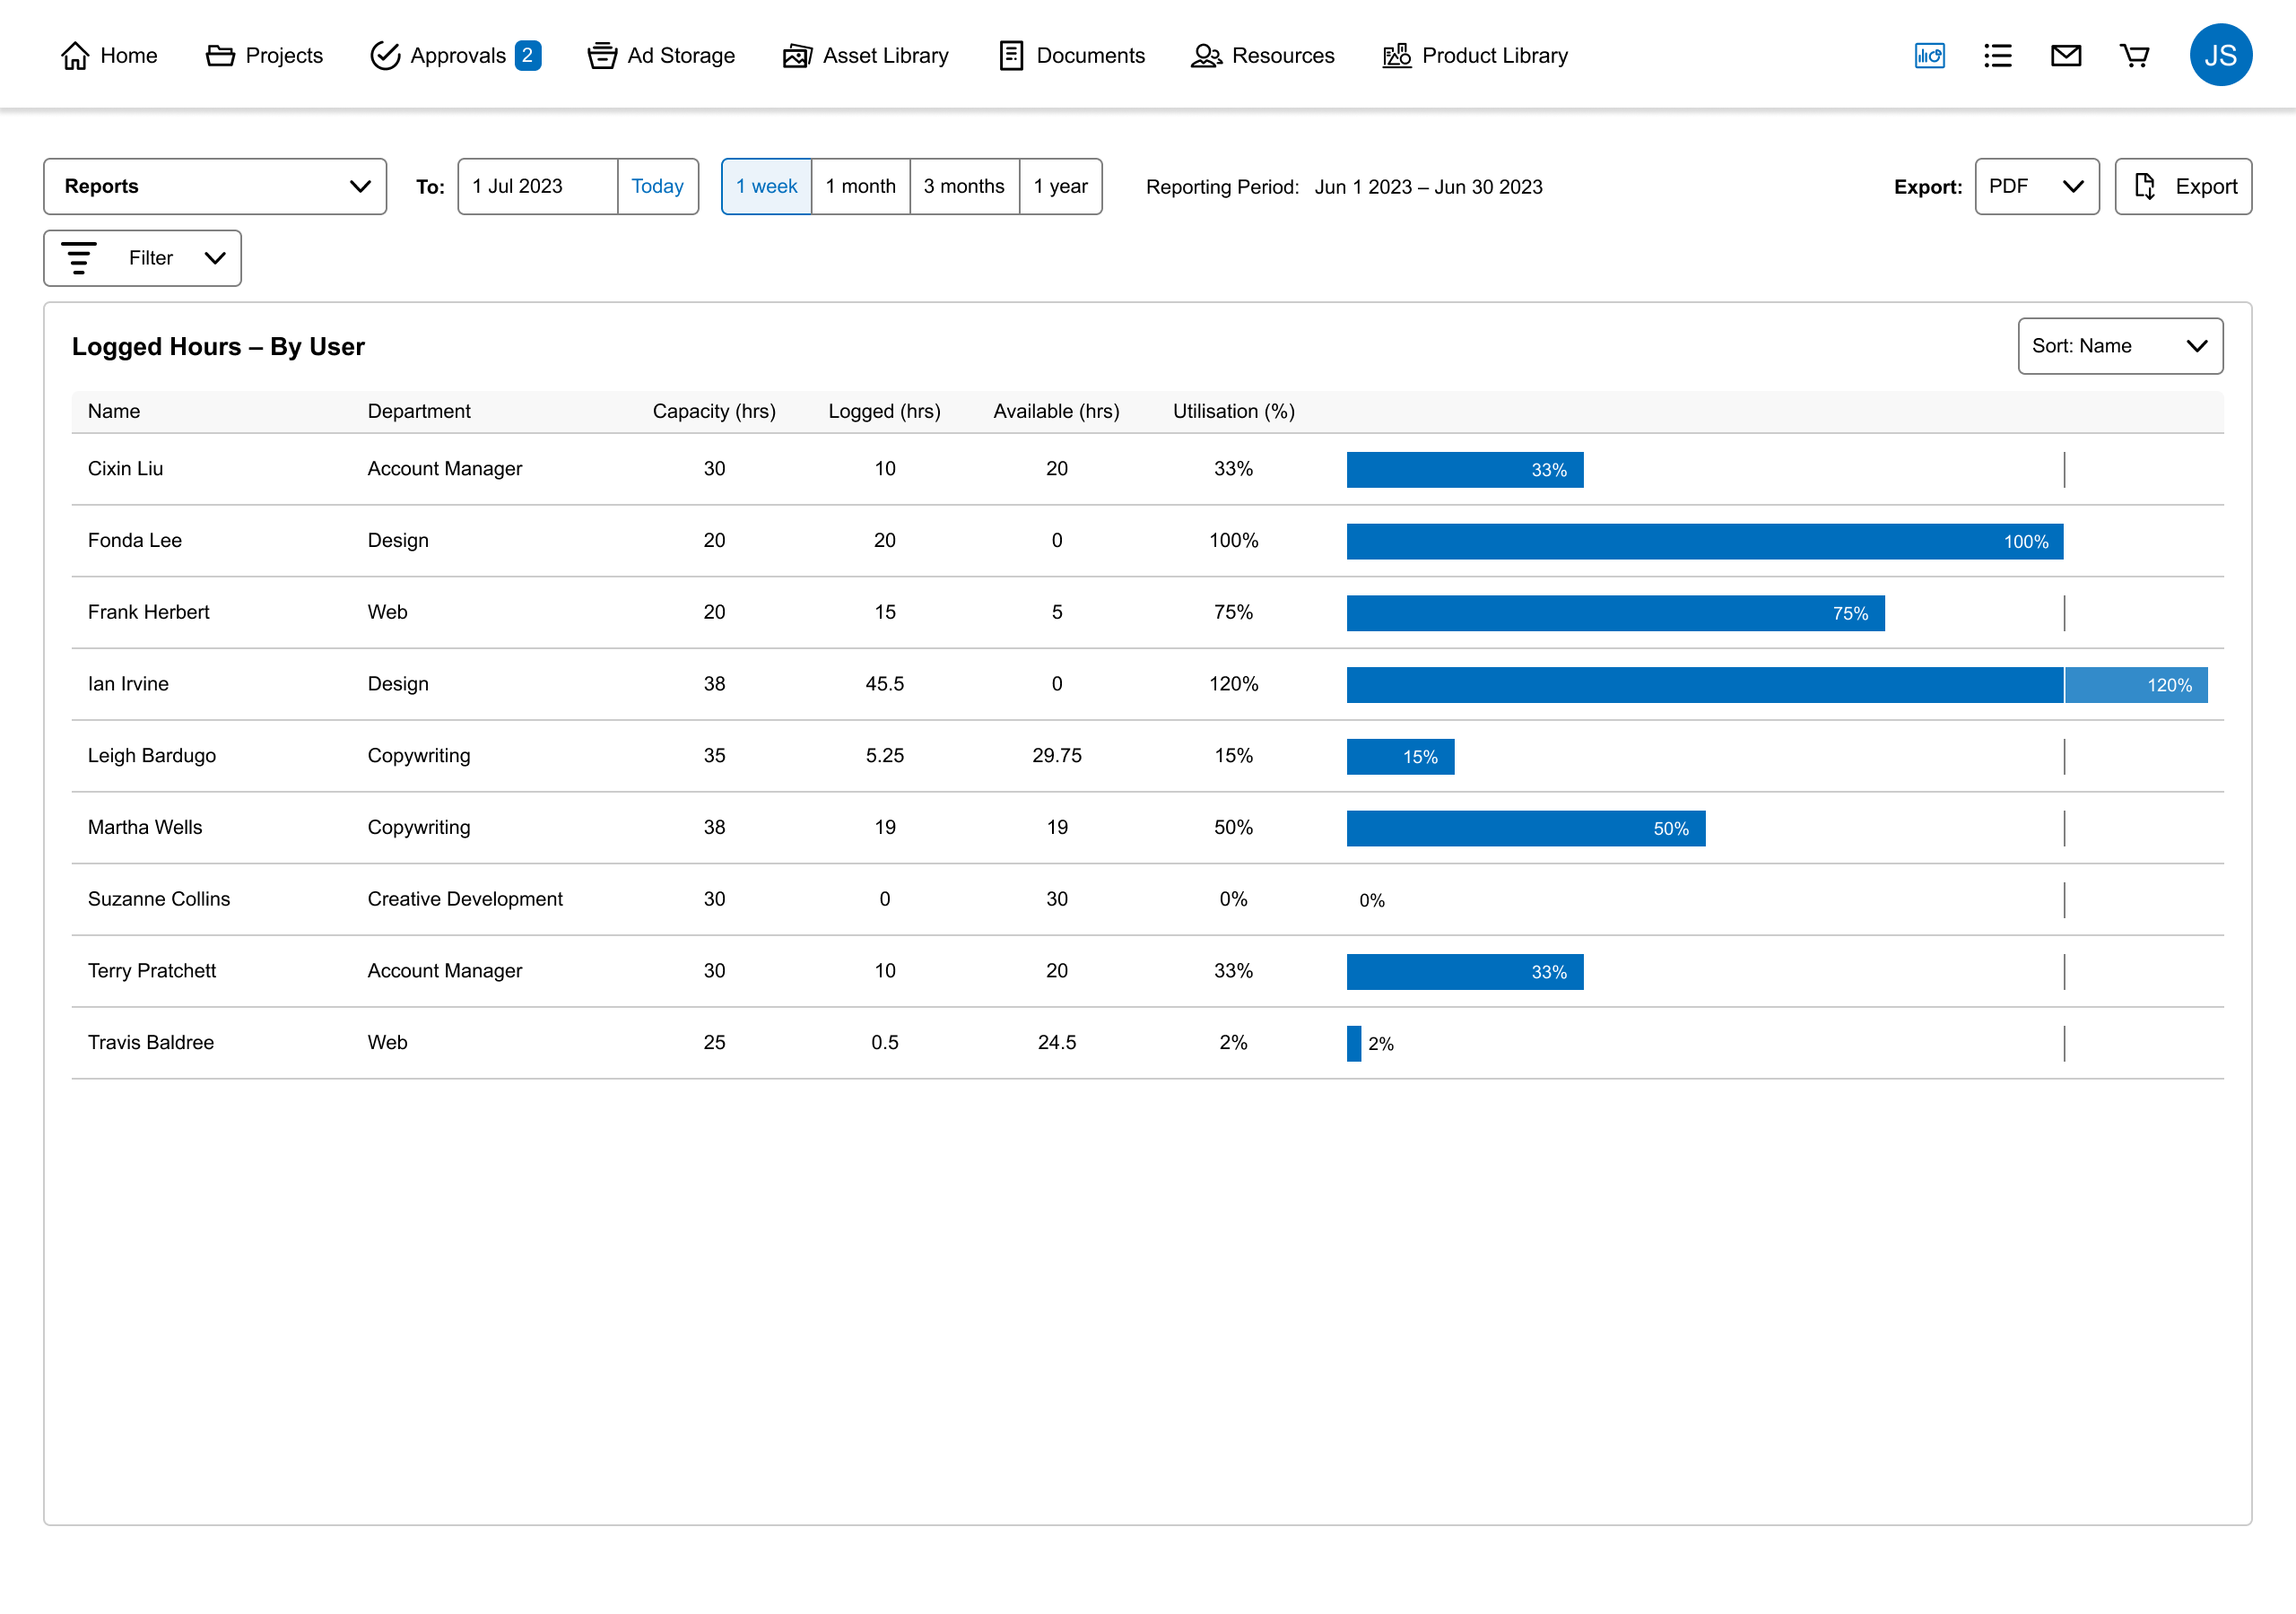
Optimizing resource management is a breeze with Admation's latest Dashboard Charts. This feature offers an in-depth view of user activities, tracking logins and the time invested on various tasks and projects. This vital data enables you to gauge team engagement and productivity levels with ease, facilitating better resource allocation and project management for creatives. By understanding the intricacies of time spent on different tasks, you can streamline processes, identify opportunities for efficiency, and ensure that your team is working cohesively towards delivering marketing projects.
Admation's Dashboard Charts allows you to effortlessly compare current data with insights from previous months and years, serving as a powerful tool in your marketing project management software. By juxtaposing current trends with past performances, you can uncover patterns and identify growth trajectories, facilitating smarter, data-driven decisions. Harness the power of comparative analysis to refine strategies, identify opportunities for improvement, and steer your marketing initiatives in the right direction with confidence.
Discover more about Admation's new Dashboard Charts, watch this short video.
Dashboard Charts revolutionizes the way you access and interpret your data by providing a visual representation of your information. With easy-to-understand visuals, this feature simplifies the process of analysing and comparing different datasets. By presenting your data in a visual format, Dashboard Charts enables you to quickly identify patterns, trends, and correlations, allowing for a deeper understanding of your marketing operations. Whether you need to compare project timelines, track approval processes, analyze resource allocation, or uncover evolving trends, Dashboard Charts makes it simpler than ever before. Say goodbye to sifting through spreadsheets and hello to a more intuitive and efficient way of accessing your data.
With Dashboard Charts, Admation brings your data to life, empowering you to optimize marketing strategies and achieve greater project success. Easily spot trends, patterns, and correlations between variables, making informed decisions that drive your marketing efforts forward.
No more tedious hours spent manually creating charts on spreadsheets. With Dashboard Charts, Admation revolutionizes the process by automating the generation of charts for you. This innovative feature takes away the hassle of data manipulation and presentation, allowing you to focus on what truly matters – analyzing and interpreting the insights provided. By streamlining the chart creation process, Admation empowers marketers to make data-driven decisions with ease and efficiency. Say farewell to the days of spreadsheet headaches and embrace the simplicity and convenience of Dashboard Charts.
Designed to refine your marketing operations and offer deeper insights into your team's processes and workflows, this feature promises to be an essential tool in your marketing toolkit, helping you identify areas for improvement and streamline operations.
Interested in exploring how Admation can elevate your marketing team or in-house agency to new heights? Don't hesitate to Book a Call with our Sales Team.